The Model Punt Club Player Sheets are designed to help you understand how a player’s market pricing compares to historical performance.
They are not tipping sheets. They do not tell you what to bet.
They provide structured, historical odds-based data so you can interpret pricing through a probability lens.
This guide explains how to read each section and how to think about the information presented.
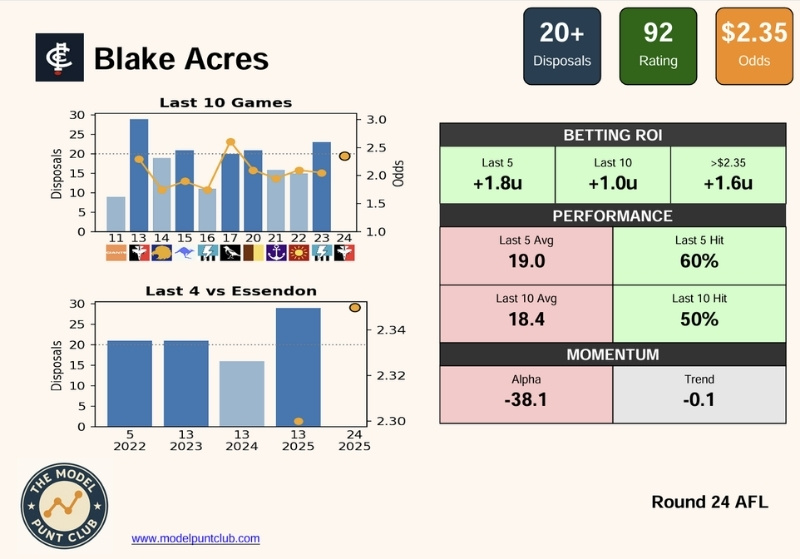
1. Player Header Section
At the top of each player sheet, you will typically see:
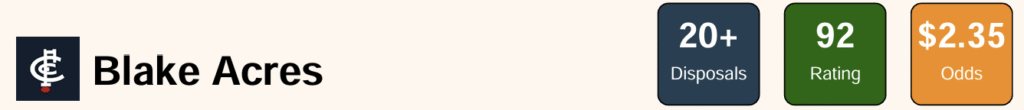
- Player name
- Blue Box: Market type (20+ Disposals, 1st Try, 3+ Goals etc)
- Green Box: Rating from low (0) to high (140)
- This is a simple odds-based rating system that identifies where in the odds cycle the player is, in the context of their last 10 games.
- Orange Box: Bookie odds
- Simply the odds at the time of creation.
- Implied Probability = 1 ÷ Odds
This section sets context, while the rest of the sheet evaluates whether the odds make sense historically.
2. Last 10 Games Chart
The visual bar chart shows the player’s recent performance snapshot with respect to the specific market (20 disposals for this example).
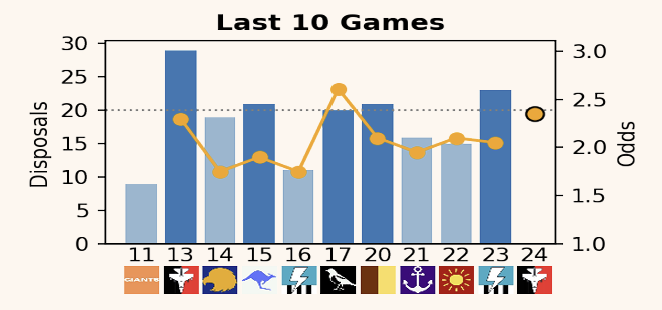
Light blue = miss
Dark blue = hit
Orange line = historical odds
It helps answer quickly:
- Has the player been fit and playing every week?
- Is production consistent or volatile?
- Is output stable or influenced by role changes?
- Which teams are they performing or not performing against?
- Are the current odds around what they usually are?
3. Last X Games Versus Upcoming Opponent
This bar chart shows their performance snapshot with respect to the specific market in recent games against the same opponent.
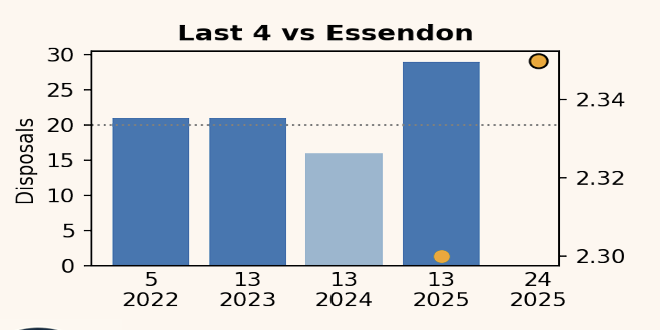
Light blue = miss
Dark blue = hit
Orange line = historical odds
Some players perform consistently better or worse than expected against particular rivals. This is a quick way to identify that phenomenon.
4. Betting ROI Section
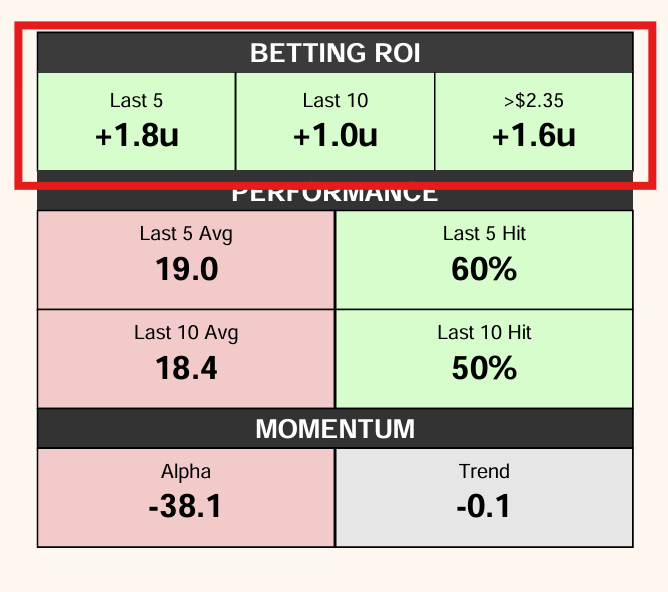
This section shows hypothetical return on investment (ROI) if backing that player historically over certain periods or at certain price bands.
Last 5 ROI – The return if this player/market was backed in the last 5 games. +1.8 units
Last 10 ROI – The return if this player/market was backed in the last 10 games. +1 unit
ROI at current odds or better – The return if I only placed a bet on this player/market during the last 10 games AND the odds were at current level or better. +1.6 units
It shows how that player profile has performed historically at similar price points. It is there to answer:
Has this type of pricing historically been profitable?
5. Performance Section
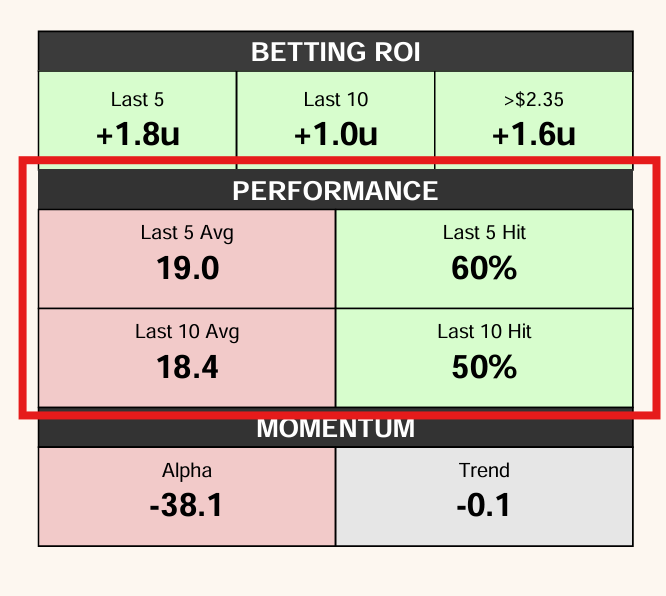
There is an important distinction between a player’s average and the frequency at which they hit certain thresholds. For example, a player may average above 20 disposals but only reach 20 in 1 of 5 games.
Last 5 and Last 10 Average – The player’s average disposals/goals/tries over the last 5 and the last 10 games.
Last 5 and Last 10 Hit – The rate at which the player achieved the threshold in their last 5 and their last 10 games.
6. Momentum Section
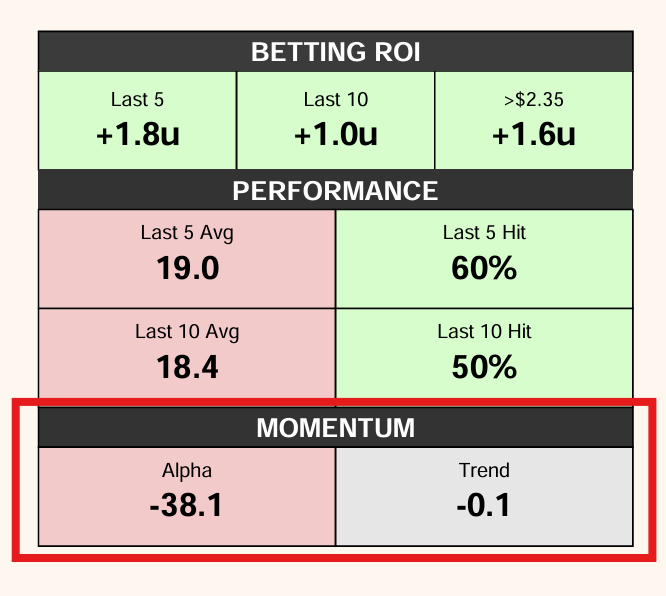
Momentum identifies short-term trend strength by comparing a player’s recent output to their established average.
Alpha is specifically created for first and last try/goal scoring markets – it measures the difference between the player’s recent share of team output (last 5 games) and the market’s implied probability.
Trend shows the direction of the performance change across recent games. It reflects whether output is moving upward, downward, or remaining stable over recent games.
7. The Core Principle and Interpretation
The value of the player sheets lies in historical odds context and structured probability analysis.
Betting is a pricing exercise.
Every price represents an implied probability.
Every player has a performance profile.
Therefore, odds can represent good, bad, or neutral value. A bet that represents poor value can still win, likewise bets presenting tremendous value can lose. That is the lens through which the entire sheet should be read.
Access the full AFL & NRL player prop data.
Every game-day sheet. Every listed market.
400+ games covered each season.
Bet Smarter. Join the Club.
#ToolsNotTips
Browse more articles